1 Introduction: the empirical workflow
Econometrics is much easier without the data—Marno Verbeek
The quote above does not only apply to economics and econometrics, but to all of the social sciences in general. Empirical research—that is, dealing with data in all its forms—requires a rigorous approach, even more so, with the increasing emphasis on openness and reproducibility of all kinds of scientific research. Therefore, it is strange that in academic education there is not much guidance in choosing which research tools to use and in the philosophy behing choosing an efficient and reproducable workflow.1
This note deals with the suitability of various software packages for applying applied econometrics in specific and data science in general.2 Specifically, In will focus on STATA, R and Python.3 I will not say which tool to use. Instead, I will focus on the various strengths and weaknessess of each software package combined with it specific approach. The main elements I will consider are the package suitability for education and how well it can be integrated in an efficient workflow. The former is mostly important for doing (small) data exercises, whilst the latter is vital for larger research project, such as theses and later on perhaps research papers.
To illustrate why the concept of reproducibility is vital, note that a typical empirical workflow in the social sciences looks as follows:
- Generate data
-
Data is read from an external source (recording, questionnaire, file or online database) or is simulated.
- Manipulate data
-
This is usually the most time demanding phase4 and includes (amongst many other things) manipulating missing data, merging data and relabeling data
- Analyse data
-
This phase includes not only standard ecometrics and statistical or machine learning techniques, but as well as graphical representations as maps and figures.
- Present results
-
Finally, documents in the forms of papers, posters, theses, or presentations have to be drafted. Note that ideally one wants to do so in various formats, such as in pdf for physical papers and in html for web display.
Unfortunately, all these steps do not necessarily run sequentially in time. Supervisors, referees, colleagues, and the future you, always want to add or delete elements to or from your research. For instance, variables have to be added, model specifications have to be checked, and 3D pie charts have to be changed in something useful.5
Therefore, it is vital that all these steps are both (i) very well documented so that the future you can easily retrace your steps, implement changes and redo the whole research if needed, and (ii) well connected to each other. The latter does not necessarily entail that the whole research should be done in one software environment, but instead that the outcome of one research step (e.g., generating data) can easily serve as an input for another step (e.g., data manipulation).
In the next section I will lay out the strengths and weaknesses of three statistical software packages with this workflow in mind. Subsequently, I discuss the suitability of each package in teaching and, thereafter, I conclude with some more general comments.
2 Statistical software packages
I review the various packages according to several criteria. There are several others that will be discussed, but these I find most important for a suitable software package to be used for teaching in the social sciences.
- Open source
-
The most important argument to use an open source package is reproducibility. Your work is simply less accessible and thus reproducible if the code can only be run with applications that costs over .
- Learning curve
-
First, and foremost, students should be able to use the package for straightforward econometric research. If that is not possible after one six-week’s course, the software package is not particularly suitable.
- Size of the community
-
Nobody wants to be locked in with obsolete technology. A large userbase ensures a high probability that the software package will be used and maintained in the future as well. Moreover, all sorts of indirect effects, such as user written routines, packages and documentation, come along for free with a large community.
- Usefulness outside academia
-
Often forgotten as an argument but outside academic life, some applications are more used than others. And with the recent emphasis on better preparation for the labor market, this argument seems to become more important. By the way, the application still mostly used would be the ubiquitous Excel and its related visual basic language.
- Flexibility
-
Ideally, a software approach should be both extendable and scalable. The former ensures that slight deviations from standard approaches can relatively easy be implemented. The latter is important when the size of the database increases, as typically is the case with recent improvements in remote sensing techniques.
- Scriptable
-
Finally, a software package should be scriptable—both internally as externally. Internally scriptable indicates that within the package scripts or programs can be written so that every step within the workflow can be reproduced. With externally scriptable I mean that the software package should also be used in combination with other software packages or languages, such as LaTeX, markdown, make, html, sql, C++, etc.
Other software packages that I will not review, typically score badly on more than one of these criteria. For example, SPSS is proprietary software, which has some issues with scriptability and is not very flexible. Moreover, a sizeable part of the user community moved over to other software packages (most notably R). Other software packages I will not review for reasons of similarity (such as Matlab to some extent) or my lack of experience with them (most notably SAS).6
3 STATA
STATA is proprietary software copyrighted by the StataCorp LLC corporation.7 It is especially popular among economists, although the growth of STATA seems almost comparable with that of R (Python is in its own league, however).8
The biggest comparative advantage of STATA is its learning curve (although some students might disagree). It is relatively straightforward to teach students basic econometrics (including time series, panel data and count data techniques, discrete choice models and duration models). Indeed, STATA has the advantage of being one of the only tools dedicated to econometric research. While it is not so flexible, it is often possible (and simple) to apply cutting-edge models and other techniques. For example, regressing y on x1 and x2 can simply be stated as:
reg y x1 x2Moreover, you can do so in a structured way by writing scripts (the so-called do files). Many students appreciate as well the fact that STATA command can be given interactively (via a drop-down menu) of directly from the console enabling them to memorize the various commands on the fly.
There is a large STATA community. This ensures the availability of many useful so-called user-written routines and tutorial material, whether via Youtube or in pdf (there is a STATA journal). The STATA community is not only huge, but as well very helpful (although the help documentation is oftentimes cumbersome). The first hit on Google on a sometimes not very focused question usually suffices.
Unfortunately, not many organizations outside academia use STATA—although I heard recently that some Danish consultancy agencies in Denmark do. Most organizations now typically use R or Python in combination with even more focused software applications as Hadoop or Julia (again, apart from Excel). Usually, this does not matter much as programming skills are easily transferable, but, unfortunately, the STATA language is hardly a programming language. Instead, it is more a sequence of very specific commands. Therefore, it is hard to relate the commands to something as Python.
Another downside is the flexibility of STATA. For procedures that slightly deviate from the ‘basic’ ones9, STATA can give you a hard time. Mostly, because the source code is not known, working with matrices is cumbersome (to say the least) and the number of programming tools is rather limited. Moreover, STATA can only work with one active dataset, which makes merging datasets sometimes difficult. Finally, although there are some plugins, STATA is not designed for working with data stored on servers somewhere else via application programming interfaces (API’s). Unfortunately, working via API’s10 becomes increasingly important, if not only for the recent surge in open access data via local governments, Google, Twitter, Foursquare, etc.
STATA itself is well scriptable internally. although it is less programming and more sequencing commands, for the majority of research projects this is definitely good enough. Externally, however, there are other issues which has to do with its proprietary nature. Other applications, such as great ?nix utilities as make and pandoc but as well git and github have difficulties ‘communicating’ with STATA. It is possible, however, to export from STATA to other formats, especially to ubiquitous text files format, which enables automatic generation of LaTeX tables.
Finally, alas, STATA is not open source. This hinders reproducibility, insight in the source code (“How the hell did they do that?”) as well as the transferability of data (the STATA .dta dataformat is not accessible to read directly, although many other packages, including R, have created special read procedures for STATA dataformats).
4 R
R emerged in 1995 as the open-source (GNU) version of the S language and quickly surpassed its predecessor in popularity.11 R itself consists of a base distribution which can be enhanced with packages, and it is exactly the ease of writing, distributing and using packages that makes R so attractive for many users. At the moment there are more than 10,000 packages on the official CRAN website, but Github contains many more.12
Because of its open-source nature and its large and very active community, the quality of most of the packages is almost guaranteed. Indeed, if there are killer applications in the data science world, then R has most of them, with as most notifiable examples dplyr for quick and robust data manipulation and ggplot2 for structural plotting using the grammar of graphics approach as advocated by Wilkinson (2012) and implemented by Wickham (2006).
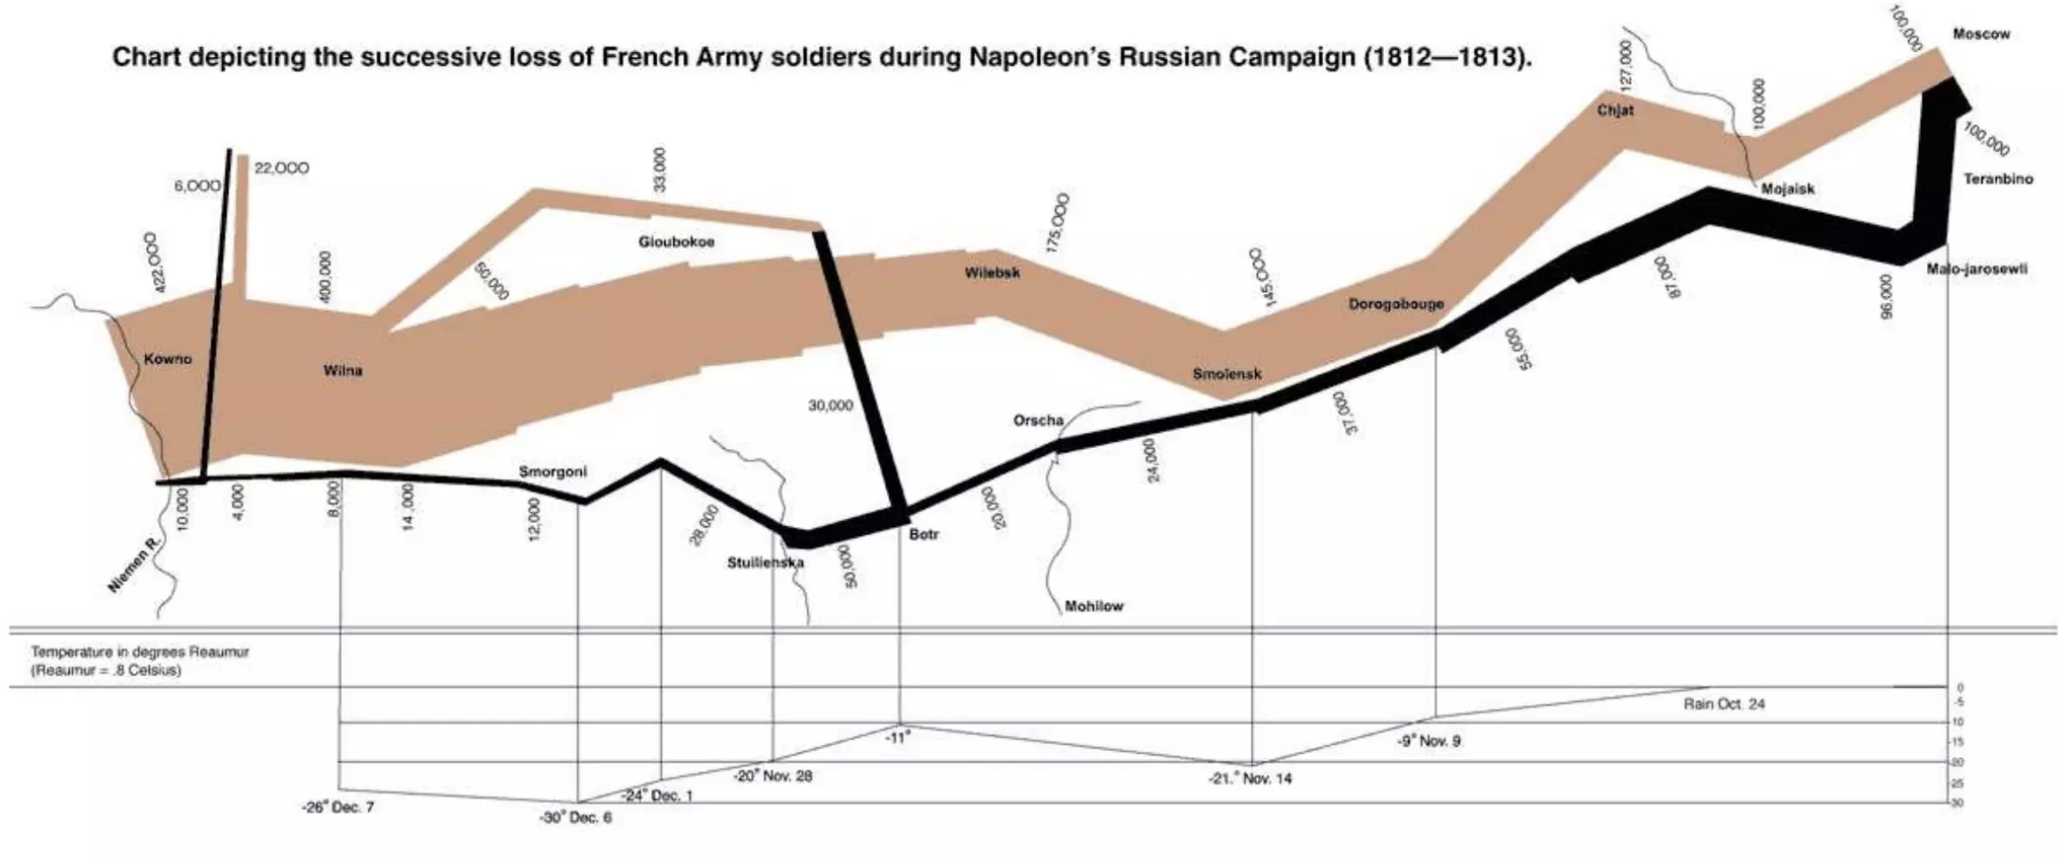
ggplot2 really advocates for the creation of diagrams with multiple dimensions, of which an early example is the well-know Minard map as below
The learning curve of R is however steeper than that of STATA.13 Having said that, learning basic R is still relatively quick (and accessible) and can be done in a short time with great free online courses. Today, teaching Stata to students requires at least one tutorial class, where teaching R can—theoretically, at least— be self-contained.
Typically, R is characterized as:
R is written by statisticians, for statisticians.
Unfortunately, this can be seen in the R language itself. Best described as ‘quirky’, the R language is not the most beautiful or best designed programming language. For example, usually there is more than one (often actually more than three) ways to accomplish something, which leads to a myriad of styles and types of coding. In applied statistics, though, R shines. Although slightly more cumbersome than STATA, commands for basic econometric techniques are relatively straightforward. Estimating a linear regression simply looks as follows:
# ordinary least squares regression
model <- lm(y ~ x1 + x2, data = data1)
summary(model)
Note the difference with STATA, where in STATA one simply uses reg y x1 x2. However, in R one can store everything in an object (in this case the object “model”) and use it later, and one can use several databases (‘dataframes’) at the same time. Both features are extremely useful for dealing with larger research projects. And although STATA still is more straightforward in basic econometrics, R users have developed several packages to emulate STATA’s ease of use.14
Because R is very flexible and the community is that huge (across disciplines as well), for almost every (statistical) problem a package most likely is developed (if feasible). The problem is, however, that terminology with respect to models differs across fields. Moreover, what economists find important (causality anyone?) is generally less important within biometrics, physics, statistics of sociology. So, using R also means spending a great deal of time finding and checking the correct package.15
If anything, R if flexible in terms of what it can do. Spatial data analysis, Bayesian inference, optimization, network analysis and—above all—producing wonderful plots that can even be used as interactive web applications. Therefore, it is used intensively outside academia as well by large companies such as Facebook, Google, Twitter, Microsoft, Booking.com, Uber and Airbnb, mainly for ‘quick and dirty’ data science and data and output visualization.
Unfortunately, R is not very scalable, as only internal computer memory (RAM) is used for data storage (similar to matlab, STATA and comparable languages). There are ways to circumvent this (typically in combination with other languages, such as Hadoop or using parallel computing techniques), but it is cumbersome for very large research projects with huge amounts of data (remote sensing data in geographical analysis comes to mind or up to 100 million records when using micro data).
Finally, R is extremely scriptable, both internally and externally. Internally, the R language is a full blow object-oriented language, although perhaps not the most beautiful one. Especially the ease of writing and reading packages is very useful for groups of researchers who are working on the same project. Externally, R really has a comparative advantage as that it can be scripted from a command line (a terminal), can be used in combination with other languages (e.g., python via rpy and C++ via rcpp to speed up procedures if needed) and works as a charm in combination with both LaTeX and html for creating webpages.16
5 Python
Opposite to STATA and even R, Python is an open source general object oriented programming language more in line with a language such as C++.17 Python was implemented by Guido van Rossum in the late 1980’s and was built on the Modula-3 programming language. As it is a general progamming language one needs several so-called packages in order to make it work for econometrics in particular and data science in general, most notably: NumPy, SciPy, Matplotlib and pandas.
Using Python for applied econometrics is not as straightforward as in STATA but nowadays relatively similar to R using SciPy.18 A typical regression routine looks as follows:
import ols
mymodel = ols.ols(y,x,y_varnm,x_varnm)
mymodel_summary()
which is rather close to R, although the ols class from SciPy needs to be loaded. The class is however not as general as the lm function from R.
For an introductory econometrics course this might be too cumbersome. However, the language itself is defined beautifully and everything works similarly. So, once you get used to the seemingly cumbersome approach of Python with respect to basic econometrics, other functionalities requires far less investment in time, because the grammar, style and approach is always consistent.19 Note, that this is rather different from R which is far more chaotic in terms of approaches, which might lead to the argument that Python is actually simpler than R to learn because of its uniformity.
So, arguably the learning curve of Python is much steeper than that of STATA or R. However, in the end it does pay off when learning the language as it is not only a good language for learning programming, it is as well very useful for projects just outside the realm of basic econometrics. Working with strings (text analysis), images, spatial data, API’s, large amounts of data, etcetera, is all very common and relatively straightforward in Python. Moreover, the community is very large (larger than that of R). But, not all of them are working in data science.
R and Python are often compared in their usefulness for statistical research in particular and data science in general.20 The outcome is still undecided. R has the killer applications but Python is catching up fast. Python is perhaps faster and at least better scalable, so perhaps should be considered for larger projects. One of Python benefits is that it is a more general skill which could be applied for other tasks as well. In any case, both of them are used very frequently outside academia.
Finally, Python is perhaps even more scriptable than R and can be combined with other languages as well. In terms of literature programming, Python has interactive notebooks (now called Jupyter notebooks) which are web applications where text and code can be run interactively.
7 Concluding remarks
What is often heard by students (and staff) is that they do not want to be programmers but social sience researchers instead, and I acknowledge that. My plea here is perhaps not to definitely choose for one of the applications above, but for a more systematic thinking in the type of research tools we teach our students and for trying to do so consistently throughout the academic curriculum. Teaching an introductory Python course, for example, and not using elements of that course in later courses seems a definite waste of time. So, above all, if STATA, Python or R is learned, let it come back in some form later at least in every period. Most courses somehow do use data (if only to create 3D pie charts).
Finally, by the audience at large there is now a greater need for reproducibility. This requires teaching our students perhaps different research tools and perhaps a different workflow when it comes to empirical research. At least, greater emphasis should be put on revision management, openness and scripting. Granted, some research tools are better in this than others, but it typically is the combination of research tools and the philosophy behind the set of research tools used that is essential.
References
Footnotes
There are some exceptions, see, e.g., Healy (2011) and Arribas-Bel and Graaff (2014) for a workshop I gave together with Daniel Arribas-Bel.↩︎
There is a difference between econometrics on the one hand and applied statistics (including the now very popular data science) on the other hand. Economics students first and foremost need to able to apply applied econometric techniques, such as presented in Stock and Watson (2020) and perhaps later in Angrist and Pischke (2008).↩︎
I will also briefly touch upon some other packages, but these three mentioned are most likely the ones most used in economics, except of course for the ubiquitous Excel.↩︎
There is and old saying that says that 80% of your research time goes in transforming data, while 20% is only spent on analysing the data.↩︎
For a wonderful timelapse video on the nonlinearity and even sometimes chaos of writing a research paper, see this link.↩︎
I should mention the object oriented matrix language Ox as well, which is mostly used by econometricians. Because of the steep learning curve and relatively small community I will not consider it here, but I am aware of its popularity in some particular research groups.↩︎
I have to be careful though in making these sorts of statements. Usually, the popularity of software applications is researched by looking at search engine counts for jobs, frequently asked questions or counting popularity on the stackoverflow site (https://stackoverflow.com/). An interesting recent overview can be found on http://r4stats.com/2017/06/19/scholarly-articles/.↩︎
Although the set of ‘basic’ procedures is quite extensive.↩︎
Note that I do hesitate to drop the hype term ‘big data’ here.↩︎
See http://blog.revolutionanalytics.com/2017/01/cran-10000.html.↩︎
Steep learning curves are in principle not problematic as it indicates that you learn rapidly and in the end the pay-off should be large. For ‘quick and dirty’ solutions, however, steep learning curves are problematic.↩︎
Good examples are the margins package in R that has similar features as the very useful margins command in STATA and the plm package for implementing fixed effects.↩︎
Fortunately, there is the great website CRAN Task Views which gives good overviews of the most important packages in several subfields, such as dealing with spatial data, Bayesian inference, econometrics and mathematical programming.↩︎
R has one of the best implementations of so-called literate programming via the package knitr. Literate programming as originally coined by Knuth (1984) indicates that output of coding and documentation are generated simultaneously. Whether or not this is a good idea for larger research projects, literate programming can be very useful for generating documentation of R packages, web blogs, teaching assignments and smaller research papers.↩︎
Although there are some good tutorial texts to be found on internet, such as Sargent and Stachurski (2015).↩︎
For example, working with geospatial data by using the excellent GeoPandas package is then a breeze, which as a bonus might also obfuscates the need for using expensive and bloated GIS software applications.↩︎
This seems another of these heavily disputed standard wars, such as the notorious editor war. A nice infographic of pros and cons of Python and R can be found here.↩︎